O'Grady Lab
  • Home
  • News and Events
  • People
    • Current Members
    • Undergraduate Research
    • Past Members
  • Research
  • Publications
  • Data
    • Mitochondrial Primers
    • Nuclear Primers
    • Accession Numbers
  • Photos
  • Courses
  • Educational Outreach
  • Links

Merging Phylogenetics with Niche Modeling to Examine the Evolution of Climatic Niches

11/9/2012

3 Comments

 
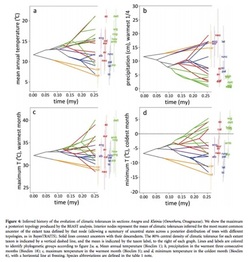
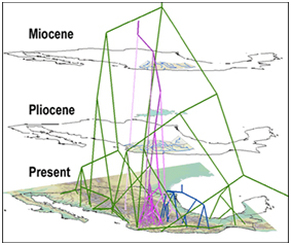
In their 2009 paper “Climate, Niche Evolution, and Diversification of the“Bird-Cage” Evening Primroses”, Evans et al. integrate climatic niche models and dated phylogenies to characterize the evolution of climatic niches in several taxonomic groups of the evening primrose. To do this, MAXENT was used to predict species occupancy of climatic niches. From this they quantified climatic disparity among taxa which was then used as a proxy for how niches have evolved. Using phylogenetic trees and niche differences, they inferred the evolutionary history of climatic tolerances for  the primrose taxa in the southwestern US and California. They inferred that the speciation has occurred in response to temperature variation in past climates across this region.

This is an exciting application that combines phylogenetic, species distribution and environmental data. However, there are some assumptions at the core of environmental niche modeling that should be highlighted when considered this type of analysis. First of all, just because an organism is found in an area does not mean that this is its optimal niche. A population may be in an area that was previously its optimal niche or was the niche it evolved
into, but, due to changing climate, may now be in a suboptimal habitat, stuck as a relict. This is often the case for source and/or sink populations and may most likely occur for long-lived species like corals or large trees.   Another issue is that the variables you choose for your environmental niche model may not be the key factors driving
presence or absence of a population. Say for example you chose temperature and precipitation variables to build you niche models, but actually, soil or  species interactions are more important.  If niche evolution models are of
interest, this could be very important because you are assuming the strongest correlated niche variables are drivers of speciation. Finally, when using environmental data, much of it is available in very course scales and may not
really represent on-the-ground ecology or natural selection. For example Bioclim is often available in 30” grids (1 km2 at the equator). Within each grid there may be a tremendous amount of temperature and moisture variability due to micro-topography, slope direction, vegetation, soil type, etc.  It may be worth spending time on the ground looking in detail at the organism’s actual niche to see if any micro-patterns emerge.

Evans et al. do clearly mention these issues and try to control for them. The issues are universal problems for niche modeling and difficult to avoid. Several ways to confirm that the plant species they examined are truly in optimal niches would be to out-plant one species into another species’s niche space. This could be done in controlled greenhouse experiments and in the field. If the plants survive the switch and are able to reproduce, the original niche spaces may not be optimal. One caveat is that species may live in a place because of their ability to tolerate extreme climate events which do not happen very often. Another interesting thing to do would be to look at gene expression during the maximum and minimum temperature events for different species. This would tie environmental variables with genetic expression. I enjoyed this paper and recommend it to others.
3 Comments

Phylogenetics and ecological niche modeling  

11/9/2012

1 Comment

 
Picture
The other day I got into a class discussion about ancestral state reconstruction, or the assignment of ancestral states based on extant taxa. Some people thought that character mapping was not scientifically sound unless you had a time machine. I, however, disagree. The utility of phylogenetics is to determine evolutionary relationships between extant taxa, and while time machines do not exist, systematists are able to make hypotheses about these relationships. I think character mapping follows the same principles and gives science more insight into diversification processes. However, one problem I do see with ancestral state reconstruction is that your analysis is only as good as your phylogenetic tree. As many people say, “junk in, junk out.” Therefore, use with caution.

One new ancestral state reconstruction method I recently learned uses the software package Phyloclim maintained by Christoph Heibl. Phyloclim is a package implemented in R that integrates species ecological niche models with phylogenetics in order to calculate and visualize niche evolution on a phylogenetic tree. To do this, the user must first create a predicted species occupancy model. This involves using ecological niche modeling software, such as Maxent, and species location data stored as a raster file--I believe this is done in a mapping program like GIS. There is a great tutorial on the Maxent website.

Patterns of niche evolution or niche conservation can then be determined by comparing the variation between niche space within and between subclades. One of two outcomes is expected: 1) either niche evolution occurs between subclades with conservation of niche space within each subclade or 2) niche conservation occurs between subclades and niche evolution occurs within each subclade. This means you could either see a divergence of niche spaces at the beginning family followed by conservation of their niche spaces or you would see niche space preserved early on in evolutionary history followed by diversification among species. Inference can then be made about ancestral niche spaces using a statistical analysis, and a statement of how climate (or other variables) may or may not result in the diversification of a group.

I really liked using this R package. The visual of ancestral state reconstruction (see figure above) is really informative and neat to look at. However, Phyloclim is still quite new and no formal tutorial from the developers exists, but there are examples in the software package complete with example data. I have yet to try using my own data in Phyloclim, but I think it’s as simple reading a .csv file of your ecological niches models and your tree file in newick or nexus format (I like this tutorial) into R. I realize this may be easier said then done, but in theory it’s simple.

Jessica Craft

Useful papers:

Evans, M. E. K., S. A. Smith, R. S. Flynn, and M. J. Donoghue. 2009. Climate, niche evolution, anddiversification of the ’bird-cage evening primroses’ (Oenothera, sections Anogra and Kleinia). Am. Nat. 173: 225-240.

Fitzpatrick, B.M & Turelli, M. 2006. The geography of mammalian speciation:mixed signals from phylogenies and range maps. Evolution 60: 601-615.

Phillips, S.J, M. Dudik, & R.E. Schapire. 2006. Maximum entropy modeling of species geographic distributions. Ecological Modeling 190: 231-259.

Warren, D., R.E. Glor, & M. Turelli. 2008. Environmental niche equivalency versus conservatism: quantitative approaches to niche evolution. Evolution 62: 2868-2883


1 Comment

Genetic barcoding and mythical creatures

10/12/2012

1 Comment

 
As a fly enthusiast, I understand how daunting a task identifying species can be. The minute details, the crazy terms: it can all make you lose your head, especially when you’ve gathered a seemingly infinite amount of specimens. But, what’s a scientist to do? 

You could hunker down at a microscope and wait until your eyes cross, or you could head down the road of genetic barcoding. Now, simmer down, you taxonomists. I don’t plan to argue you guys out of your jobs. In fact, I have my own criticisms of barcoding, but just humor me for a moment.  

Genetic barcoding works by sequencing small DNA portions from unknown organisms and comparing those sequences to a barcode library. So say you’ve collected a bunch of something, let’s say unicorns from the North Pole as everyone knows all magical ponies live in the wintery north. Well, as a well-known unicorn scientist you are aware that there are several cryptic species of unicorns. This means that two or more species appear morphologically similar but, by at least one of the many species concepts, are still considered separate species. A quick PCR analysis, PCR gods forgiving, and a BLAST to the NCBI database could tell you which mythical unicorn species you now possess (should the barcode library of unicorns be complete).

Okay, I may have lied. Unicorns don’t really exist (outside the imagination of yours truly), but the problem of cryptic species does, along with a myriad of other identification issues such as morphological variation within species and even between adults and juveniles. Have you ever looked at drosophila larvae? They all look like squiggly, little, wormy things, every single one of them. Aside from some neat distinguishing behaviors –  a few fling themselves like trapeze artists – you couldn’t tell them apart.

So, it makes sense that a useful tool like barcoding has received so much attention, but let’s not get carried away. This isn’t the messiah come here to solve all our problems. The way I see it genetic barcoding is the microwave of the 1970’s housewife: a new tool for the modern taxonomist. It heats your food in mere minutes, but you can still burn the pot roast. Criticisms include incorrectly identified species sequences, a substantial error rate, and lowered ability to distinguish between recently diverged species. These comments all point towards the necessity of well-studied taxonomists to make final decisions.  

Me? I’m sticking to the microscope for now. Having a good grasp on taxonomic identification seems like it will always be a useful tool.

Jessica Craft
1 Comment

Aquatic insects, biomonitoring, and climate change come together in the BIGCB

10/12/2012

1 Comment

 
Not many people get paid to be twelve years old, at least not as adults, so I feel I’m one of the lucky ones. I’ve been working on a project that lets me go to so some beautiful rivers and streams, flip over rocks, and look for aquatic insects. It kindles the fun and curiosity that I remember while doing that kind of thing when I was a kid. Now, of course, I have a research question in mind while I’m out there. Our lab has been conducting surveys of aquatic insects in a few representative Northern California watersheds to establish the composition of aquatic insect communities, create a DNA barcoding (see this blog, too) database of Norcal aquatics for more efficient biomonitoring in the future, link taxa to characteristics of the habitat, and, using landscape genetics, make predictions about how global change biology may affect our local rivers and streams.

Aquatic insects have been used in biomonitoring for about a century as a way to assess the health of riparian areas. Biomonitoring adds informative data to chemical testing of water. Chemical testing provides valuable information about a particular component, such as dissolved oxygen or the concentration of a pollutant, at one moment in time. Biomonitoring is a way to assess whether all of the components of a system are such that they support the surveyed organisms over their entire lifespan. Both chemical and biological surveys can be combined to give a fuller picture of ecosystem health. Biomonitoring of aquatic insects is now being used not only to assess current and past ecosystem health, but also to predict future changes, for example in response to climate change.

In recent years, concerns about the effects of human-driven climate change on riparian ecosystem have increased. Climate change is projected to alter precipitation patterns, the timing of seasonal transitions, and extremes of both heat and cold, among other effects. These changes will affect different members of biotic communities differently according to their ability to adapt to changing conditions or disperse to more favorable habitat. We can use species distribution modeling to identify key characteristics of favorable habitat, and use patterns we find today using landscape genetics to identify potential obstacles that could prevent taxa from shifting ranges.

We are fortunate to be doing this as part of a larger consortium on campus, the Berkeley Initiative in Global Change Biology, or BIGCB. With funding from the Vice Chancellor’s Office, the Moore Foundation and the Keck Foundation, the BIGCB is focused on global change forecasting for California ecosystems, using analyses of fossil, historic and current data to better understand California ecosystems responses to environmental change and make predictions of future ecosystem changes.

Brian Ort
1 Comment

How to adapt to a new freshwater environment

10/12/2012

0 Comments

 
Which genomic changes underlie rapid adaptation? Do these adaptations come from new mutations or from genetic variation already existing in ancestral populations? Are the genomic regions found in protein coding or regulatory regions? This list of questions reads like the intro to a Trends in Ecology and Evolution article on hot questions in evolutionary biology, and is what Jones et al (including David Kingsley) approached in 7 pages of awesome, detailed work on the genome biology of sticklbacks.

Threespine sticklebacks are famous in the evolution world as a study system for rapid adaptation and speciation. In separate populations all over the world, they invaded from the ocean to adapt to the new freshwater environments created after the Pleistocene glaciers retreated about 11,000 years ago (evolutionarily speaking, this was very recent). This created naturally replicated marine/freshwater population pairs that still hybridize in nature. They even can be raised in a lab, which means they can also be experimented on. We know that all plants and animals have adapted to changing conditions at some point or another in their history, but the process is difficult to study in many organisms, and often the genomic signatures of such change are often obscured by the effects of too much time having passed. The sticklebacks have a perfect storm of attributes that make them great for studying these sorts of questions.

In a paper that begins by presenting the first threespine stickleback genome (which is exactly as far as many first genome papers go), Jones and collegues then go deeper into the system, using that genome to look in detail at how it responded to such recent and drastic environmental change. They leverage the power of the naturally replicated freshwater invasions by generating 20 additional genomes from marine/freshwater population pairs all over the world. In order to assess parallel changes occurring across the entire genome, they looked for regions in the genomes that were similar among all the freshwater animals worldwide but different from the marine ones. Using two complimentary approaches, they found 147 regions (0.2% of the whole genome) that were divergent among the ecotypes.

The researchers then focused in on one marine/freshwater population pair with an active hybrid zone to ask if these globally shared variants were the main ones involved or if there were also a lot of variants contributed by the local populations. They found of the divergent changes between the two populations, 35.3% contained these global variants, suggesting that there is a substantial contribution from local variants in each population in addition to what is shared across populations.

An outstanding question in biology asks whether adaptive changes occur because of changes in protein coding genes or regulatory regions. Evidence has been accumulating from a variety of systems about specific adaptations, which are typically restricted to relatively narrow regions within a genome.  This study allowed a look at what is going on across an entire genome. The authors found that of all of the freshwater variants that were shared across all populations, 17% were located within protein coding regions, while 41% were found in non-coding regions and presumed to be regulatory. An additional 43% were more ambiguous, and the authors speculate that they also primarily fall into the regulatory category. More work needs to be done to classify and verify these variants, but the results are already suggestive that a significant amount of adaptive change across the genome is due to changes in the regulatory regions.

While we are not quite at a stage of being able to write a how-to manual on adapting to a novel environment, this series of studies provides a lot of new detail on how it works in nature in one particularly well-suited system – a system truly powerful and special for its ability to give us insight into the dynamics of rapid adaptation. Even though the et al on this paper is a long list of contributors that render this approach way beyond what is possible to do by a single researcher, it is still inspirational to picture how these approaches could illuminate the biology of other natural systems.

Kari Goodman

Jones, F.C. et al 2012. The genomic basis of adaptive evolution in threespine sticklebacks, Nature, vol 484, pp. 55-61. doi:10.1038/nature10944.
0 Comments

DNA barcoding and gene-chips 

10/12/2012

1 Comment

 
When I was 19 years old I visited the Organization of Tropical Studies’ La Selva Biological Station in Costa Rica. Upon a nature hike with a resident researcher, a hypothetical, nearly sci-fi idea was thrown out for ways to significantly improve field work. The scientist painted the picture of a futuristic pocket-sized chip that could puncture leaf or animal tissue, do a lightning fast DNA extraction and PCR, query a genetic database, and within minutes identify a specimen – right in the field! He proclaimed that this invention would allow scientists to categorize greater biodiversity, understand ecosystems more fully, and help to clarify the taxonomy and phylogeny of tropical species.  

Daniel Janzen, a renowned tropical ecologist and professor at the University of Pennsylvania, is a major proponent of this theoretical device. Janzen has been involved in the 'Consortium for the Barcode of Life’ project, which includes members such as the Natural History Museum in London, the Smithsonian in the US, the University of Guelph in Canada, Rockefeller University in New York, and a host of other institutions. The goal of this research consortium is to use a single DNA sequence, (cytochrome oxidase I, a mitochondrial gene), to essentially tag, or “barcorde” every species on earth. Having one gene with which to identify all biodiversity is a lofty task that will require many skilled technicians in functioning genetic labs, as well as taxonomic experts to assign appropriate names and voucher specimens to all of these sequences. Still Janzen suggests that with the use of the proposed ‘gene chip’ the process could be conducted by a “six-year kid walking down the street.”  

Progress has already been made in the construction and usage of this 'theoretical' device. Mesa Tech International has developed the ‘DNA dipstick,’ a hand-held, battery-powered, disposable device that can identify nucleic acid sequence-level data within hours. This device has been used to identify microbial pathogens in agricultural crops and animals and thus improve human health. DNA microarrays have also been used in the Fish&Chips project which hopes to identify and categorize marine biodiversity. This project uses a ‘bio-chip’ made of glass that contains oligionucleotides fixed to the chips’ surface, which acts as a probe to bind complementary target DNA sequences by hybridization. This group also has a Phytoplankton Chip and Invertebrate Chip. With such technological developments in recent years, the quick identification of specimens in the field, as proposed by the Costa Rican researcher some years ago, suggests that this goal is not so far-fetched. DNA barcoding and the use of gene-chips will undoubtedly herald science into a new era, as we begin to database and identify genes of all of earth’s species. 

 Iman Sylvain
1 Comment

On barcoding, bandwagons and the nature of scientific revolutions

10/12/2012

1 Comment

 
Several recent events have me reflecting on how science is done and how different schools of scientific thought turn over through time.  I'm teaching a grad class in phylogenetic methods for the first time since 2007 and I've noticed a big difference in the students.  In the past, their emphasis has been on understanding the nuts and bolts of how to generate phylogenies.  While the students this year are still interested in building trees, I'm getting the sense that they view tree building as a means to an end, rather than a valid activity in and of itself.  Student interest seems to have shifted more towards using trees to test evolutionary hypotheses.  While the sample size is small, this echoes what I've heard from colleagues about two courses taught in integrative biology, IB200A (phylogenetic reconstruction) and IB200B (phylogenetic hypothesis testing).  Enrollment in 200A is dropping relative to 200B.  

It's an interesting phenomenon and makes me think we may be in the midst of another paradigm shift (albeit a small one) in how systematics is done.  Looking back over the years, you can clearly see turnovers in schools of scientific inquiry.  Here's a short list:

Numerical Taxonomy
Starting in the early 1960s, numerical taxonomists brought a quantitative approach to taxonomy and systematics that previously been absent.  This was driven largely by statisticians (Sokal, Sneath) and the notion that careful measurements could lead to improved taxonomic hierarchies.  During the 1970s this field fractured into phenetics and cladistics.  Then the cladists ate all the pheneticists. 

Cladistics (and cladists)
While cladistics and cladists are tightly linked, not all people who practice cladistics are cladists and not all cladists always employ a strictly cladistic approach.  In essence, it's a semantic argument, something that all good cladists enjoy.  I define cladists as those followers of Willi Hennig who espouse a parsimony-only approach to systematics.  They aggressively routed the numerical taxonomists in the 70s and then stuck around to rail against likelihood, Bayesian analysis, and, in some cases, evolutionary inference itself.  For more detail on this era of systematics, check out the chapter in Joe Felsenstein's Inferring Phylogenies book.

Molecules vs. morphology
Starting in the mid-1980s, the introduction of PCR led to a technical revolution in systematics.  Suddenly, everyone was scrambling to sequence DNA in his or her favorite organism and use it to generate phylogenies.  Like most of the previous theoretical and technical advances in systematics, DNA promised to "fix everything."  This, of course, hasn't come to pass and, even now that we can sequence entire genomes, some systematic questions remain difficult to approach.  What did happen was a massive shift in resources, both in terms of grant funding and jobs offered, with the traditional morphologists being on the losing end of things.  This led to a lot of animosity - I can still remember being called a "moleculoid" by some of my older colleagues.  Luckily, this has largely blown over and most systematists take a holistic approach to understanding relationships in their focal taxa.

DNA barcoding
In some ways barcoding is a spin off of the molecules vs. morphology debate.  The notion here is that taxonomy isn't really needed now that we can use DNA sequence to uniquely identify (or barcode) species.  While DNA approaches are important techniques to have in your taxonomic toolkit, throwing out all by a single character system (the COI gene if you work on animals) in your taxonomy is ridiculous.  And many people have pointed this out before.  The initial DNA barcoding push was really more of a marketing campaign than a novel scientific approach and, once again, a more inclusive approach is being taken.   

Statistical phylogenetics
The idea that phylogenies are statistical statements about evolutionary history and can not only be viewed as hypotheses but also used to test hypotheses is the predominant paradigm in modern systematics.  More advanced analytical techniques, increased processor speed, and the introduction of model-based approaches have all helped shaped modern phylogeneic systematics.  Powerful statistical methods are currently causing an expansion of systematics and driving the "use of trees" over the "building of trees."  I think this is a normal, natural outgrowth of the field and will hopefully continue to drive it forward. 

My own work is moving away from tree building and more into the area of community assembly and interaction so I've been reading a lot about phylogenetic community ecology (PCE from here on out - too much to write) as a way to merge the fields.  I ran across this interesting blog post a few days back where the author, Jeremy Fox, makes the case that PCE is a "bandwagon." He makes bring up some good points (although he uses a pseudo-subjective literature review to do so) and the post is worth a read.

This all leaves me wondering, however, if there's really anything wrong with any one field or subfield jumping on a bandwagon.  This is, at least if you take an historical perspective, how science moves forward.  For example, organismal biology jumped hard on the DNA bandwagon in the late 1980s/early 1990s, eliminating entire -ologies in the rush to capitalize on the new technology.  Within 10 years, however, people began to realize that you couldn't place those DNA-based phylogenies in context without some knowledge of basic biology so the field corrected itself, including the new theories and technologies.  I imagine this is what will happen as a result of the current push for hypothesis testing in phylogenetics.


Patrick O'Grady
1 Comment

 Visualizing Phylogeography in 3D

10/12/2012

5 Comments

 
Picture
When we want to visualize biogeographical distributions we usually create maps. When we want to visualize phylogenetics we often build taxonomic trees. What if we want to visualize phylogeography? Typically we use maps and phylogenetic trees side-by-side. There is a relatively new tool called GeoPhyloBuilder that joins the two. It is available in ArcGIS 9.3 and later versions and was created by David Kidd and Xianhua Liu of The National Evolutionary Synthesis Center (2008).  GeoPhyloBuilder builds a 3D spatiotemporal, phylogenetic GIS data model by attaching the phylogenetic tree tips to the geographical locations of the samples. The geographical locations can be points, lines, or polygons. The 3D dimension comes from the node depths of the phylogenetic tree.  Longer, older branches are elevated further above the map.  The model can be visualized in 2D or 3D in ArcMap, ArcScene, or other Earth Browsers. Examples of images and movies as well as the download are available at: https://www.nescent.org/sites/evoviz/GeoPhyloBuilder.  Although some of these images make the phylogenetic tree look like spaghetti hanging over a map, you can color code different branches to see how they relate geographically. You can also visualize the 3D images in a movie, rotating the image so that you can get varying perspectives. Passing information on is easiest when you have powerful visuals and this may be helpful for some phylogeographical results.

Lisa Marrack

Phylogenies of the freshwater fish family Goodienae: (purple; Webb et al., 2004) and genera Poeciliopsis (green; Mateos et al., 2002) and Notropis (blue; Schonhuth & Doadrio, 2003) with modern elevation and drainage. Pliocene and Miocene drainage and palaeolakes from de Cserna & Alvarez (1995). [In Kidd and Ritchie (2006): Journal of Biogeography].


5 Comments

Review: Webb et al. (2011) DNA Barcoding of North American Ephemeroptera: Progress and Prospects

10/12/2012

3 Comments

 
Picture
This paper was a convincing argument for the promise of DNA barcoding taking over the world, basically. DNA barcoding of aquatic macroinvertebrates  is gaining backing as an extremely useful tool for taxonomic identification and research, and in turn,  application in bioassessment programs.  Some have argued that DNA barcoding is an unreliable way to identify aquatic macroinvertebrates, but this paper shoots those ideas down; (!!!) as it found that the average intraspecific divergence  was 12.5%, while the average intraspecific divergence was 1.97%. While there were some complications in identification, caused mainly by polyphyly and species complexes (which still need to be further studied and resolved,) in general these results indicate that DNA barcoding is, in general, a promising tool in aquatic macroinvertebrate taxonomy and bioassessment programs. 

Aside from the intra and interspecific  divergences being accurate, for the most part, this paper further points out that DNA barcoding is particularly useful for other reasons.  In addition to helping streamline the identification, delimitation, and discovery of species, DNA barcoding also gives consistent results across life stages, which is particularly important in aquatic ecology applications, as a large majority of benthic macroinvertebrates are immature. In many cases, taxonomy is based on adult male morphology, and identification of immatures, particularly early instars, is exceedingly time-consuming and requires substantial training. Additionally, specimens are often very tiny, and delicate, which can lead, in many cases, to missing gills, caudal filaments or even legs, which can in turn further complicate accurate identifications.  Furthermore, the use of DNA barcoding allows for data standardization, and thus a broader, more accurate  comparison of results.

This paper also suggested that much more work on North American Ephemeroptera  taxonomy and classification is required, as many currently recognized species are  highly divergent. Most of these confused species have complex histories of synonymy and reflect  the 60 year trend in North American mayfly systematics towards inclusive species concepts. Further taxonomic work that synthesizes a variety of identification and classification methods including morphological, biogeographic, ecological, behavioral and molecular techniques is required to test current species hypotheses, particularly of those unusually divergent Ephemeroptera species. DNA barcoding is one of the techniques that will be useful in this aim of achieving stable, supported species hypotheses. Re-examined and updated species hypotheses will allow us to identify aquatic insects more accurately and more efficiently, which will in turn allow us to determine and communicate the ecological characteristics of a species, such as phenology and tolerance to pollutants, and thus  improve our ability to utilize these organisms in bioassessment programs. 

Natalie Stauffer


3 Comments

ITS it: Primer choice in fungal diversity studies

9/14/2012

2 Comments

 
Picture
Departmental coffee hours are supposed to be cordial affairs, a chance to catch up with colleagues and exchange news and ideas. So why was this graduate student I’d just met getting up in my face about using the “wrong” locus for my work characterizing fungal communities in Hawaii? I’ve been using the D1/D2 domain of 26S rRNA and finding an amazing amount of diversity in plant substrates Hawaiian drosophilids use for reproduction, oviposition, and larval development. The grad student seemed to think if I wasn’t pyrosequencing using ITS, I was just wasting my time. But I’m not pyrosequencing, although I am accepting contributions from benevolent patrons to do so. Instead, I’m focusing on one locus that will be informative over wide phylogenetic space without becoming saturated with mutations. In a recent paper comparing the utility of D1/D2 and ITS for yeast species delimitation, Groenewald et al (2011) found 3 to 4 times greater nucleotide diversity in ITS. That worked out great for their work, in which they combined the sequences from both loci with morphology, mating studies, and physiology to propose three new yeast species in the genus Candida. In another study, Zimmerman and Vitousek used only ITS to identify over 4200 fungal OTUs across 13 sites on Mauna Loa. BLAST searches showed these OTUs spread over a dozen or so fungal classes, but most were either Dothideomycetes (36%) or Not assigned/environmental sample (40%). The problem I see with this is that they identified 4200+ OTUs BLASTing to distant classes using 157 bp of sequence. The experiments were rigorously carried out, but saturation of variable sites, where the same base location is hit with the same mutation in multiple lineages, must be an issue. That can cause errors in defining OTUs, making less related taxa appear to be more related. So in fact Zimmerman and Vitousek may have picked up less diversity than was actually present in their samples. 

Picture
Getting back to the grad student’s criticism, is the D1/D2 domain obsolete? I did a quick search on Web of Science to find out. I searched for citations of the paper in which the NL1 and NL4 primers, which amplify the domain, were first described (Kurtzman 1997), and on the paper (Gardes & Bruns 1993) in which one of the primers, ITS1-F, used by Zimmerman & Vitousek (2012) was presented. These searches gave the following hits, broken down by year.

Kurtman’s D1/D2 domain primers have seen pretty steady use over the last decade, with a slight uptick in the late 2000’s. Use of the ITS primer has steadily increased over the same period. Why? I think it’s a combination of one locus becoming accepted as the “standard”, and the fact that there is more phylogenetic information (variation) contained within the ITS locus, which is probably why it became the standard. In addition, the sequence length works quite well with high-throughput pyrosequencing, allowing the generation of very large data sets, as in Zimmerman & Vitousek (2012).

So, which locus would you use? I still think it makes sense to choose a less variable locus when you’re searching across wide phylogenetic space. But to make more refined identifications to the level of species, I’d use ITS, and I’d like to make the switch to pyrosequencing to do it.

Brian Ort

2 Comments
<<Previous

    Patrick

    Professor
    Cornell University

    Archives

    April 2018
    March 2018
    August 2017
    March 2017
    January 2017
    September 2015
    May 2015
    March 2015
    January 2015
    October 2014
    April 2014
    March 2014
    February 2014
    September 2013
    May 2013
    April 2013
    February 2013
    January 2013
    November 2012
    October 2012
    September 2012
    August 2012
    July 2012
    June 2012
    May 2012
    January 2012
    November 2011
    October 2011
    May 2011
    February 2011

    Categories

    All
    1090
    1091
    Alumni
    Aquatic Insects
    Arizona
    Asteia
    Barcoding
    Bennett
    Blog
    Career
    Celebrations
    Chelsea
    Climate Change
    Cornell
    Craft
    Dicranota
    Dolichopodidae
    Drosophila
    Ephydra
    Ephydridae
    Field Work
    Funding
    Goodman
    Hawaiian Drosophila
    Keys
    Kidwell
    Lapoint
    Limonia
    Magnacca
    Marrack
    Montana
    Nesophrosyne
    New Species
    Ogrady
    Ort
    Paceyn
    Pak
    Panbiogeography
    Pediciidae
    Peterson
    Phylogenetic Methods
    Publications
    Readings
    Rhaphidolabis
    Scaptomyza
    Scatella
    Schedule
    Stauffer
    Sylvain
    Talks
    Taxonomy
    Tipula
    Undergraduates
    Unicorns
    Whiteman Lab
    Wojciechowski
    Wolbachia
    Wyoming
    Yeast And Fungi

    RSS Feed