|
The College of Natural Resources held their 2015 commencement last night. Lisa finished her dissertation last summer and has been teaching in Monterrey for the past year but she came to walk and get hooded. Congratulations Lisa!
1 Comment
Lisa has been awarded the Colman Fellowship for 2013-2014. This is a highly competitive award that ESPM gives to graduate students working on watershed issues.
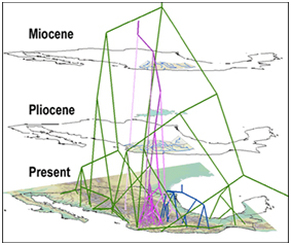
 When we want to visualize biogeographical distributions we usually create maps. When we want to visualize phylogenetics we often build taxonomic trees. What if we want to visualize phylogeography? Typically we use maps and phylogenetic trees side-by-side. There is a relatively new tool called GeoPhyloBuilder that joins the two. It is available in ArcGIS 9.3 and later versions and was created by David Kidd and Xianhua Liu of The National Evolutionary Synthesis Center (2008). GeoPhyloBuilder builds a 3D spatiotemporal, phylogenetic GIS data model by attaching the phylogenetic tree tips to the geographical locations of the samples. The geographical locations can be points, lines, or polygons. The 3D dimension comes from the node depths of the phylogenetic tree. Longer, older branches are elevated further above the map. The model can be visualized in 2D or 3D in ArcMap, ArcScene, or other Earth Browsers. Examples of images and movies as well as the download are available at: https://www.nescent.org/sites/evoviz/GeoPhyloBuilder. Although some of these images make the phylogenetic tree look like spaghetti hanging over a map, you can color code different branches to see how they relate geographically. You can also visualize the 3D images in a movie, rotating the image so that you can get varying perspectives. Passing information on is easiest when you have powerful visuals and this may be helpful for some phylogeographical results. Lisa Marrack Phylogenies of the freshwater fish family Goodienae: (purple; Webb et al., 2004) and genera Poeciliopsis (green; Mateos et al., 2002) and Notropis (blue; Schonhuth & Doadrio, 2003) with modern elevation and drainage. Pliocene and Miocene drainage and palaeolakes from de Cserna & Alvarez (1995). [In Kidd and Ritchie (2006): Journal of Biogeography]. Recent advances in sequencing technologies have allowed researchers to describe microbial richness in very fine resolution. Typically sequences are categorized into OTUs (operational taxanomic units) based on 95%, 98%, or 99% similarity between sequences. For example, Zimmerman and Vitousek found 4063 fungal endophyte OTUs (95% cutoff) on the leaves of one species of tree (Metrosideros polymorpha) at 13 sites (10 trees per site). Even with a tremendous number of OTUs, this and other microbial genetic surveys conclude that sampling may be insufficient as is evident by the lack of asymptotic response of rarefaction curves. What is the “usefulness” of this number of OTUs from an ecological perspective, in other words what does this number of species “do” for the system? To this end it might be useful to assign functionality to groups of OTU’s so that functional diversity could be incorporated into these studies. This thought led me to a review of fungal endophytes function by Rodriguez et al. 2009 in the New Phytologist. As a fungal neophyte (not endophyte) I found the review helpful.
Here are a few highlights:
Clearly, before functional diversity is assigned to OTU groups for ecological comparisons, a great deal of work needs to be done to determine the roles of the highly diverse fungal endophyte groups. Lisa Marrack Second year graduate student Lisa Marrack was awarded a George Melendez Wright Climate Change Fellowship. More information on the program is here: http://coenv.washington.edu/students/melendez_wright/
|
PatrickProfessor Archives
April 2018
Categories
All
|
| O'Grady Lab |
|


 RSS Feed
