I was talking with Patrick earlier this week about the effects of large data sets, such as from so-called NextGen sequencing (I dislike that term), on phylogenetic and population genetic methods of analysis. It used to be that the analytical bottleneck was in obtaining sequence data, but that has shifted so that now large amounts of sequence data can be obtained quickly but we are limited by computational power after we have them. I recently read a paper (Tamura et al. 2012, in PNAS) that addressed this problem by bucking the trend for building more and more statistical complexity into Maximum Likelihood and Bayesian analytical packages, and instead introduced a quick and fairly simple method to analyze large phylogenetic datasets with extensive evolutionary rate variation along the branches. The method is implemented in RelTime.
In phylogenetics we try to determine two things, the relationships between taxa and the timing of their divergence, either in relative or absolute time. The most common way to date divergence times is to calibrate a molecular phylogeny using the fossil record. Some form of a molecular clock is then assumed to extrapolate rates of evolution and divergence times to uncalibrated parts of the tree. This extrapolation requires assumptions about if and how rates of sequence evolution vary along different branches of the tree. Phylogenetics programs like BEAST require the user to specify, a priori, a statistical distribution from which to model evolutionary rate heterogeneity among tree branches. This method has been largely successful, but is limited computationally because the complexity increases exponentially as the number of taxa in the tree increases. Thus, the challenge with large datasets is that it can take weeks for even powerful computers to complete each step of the analysis.
RelTime attempts to circumvent this computational limitation by calculating relative divergence times rather than placing them in the context of absolute time. To me, it looks similar to Neighbor Joining methods used for creating tree topology, except that the method assumes a bifurcating topology with branch lengths, then uses distance calculations as it allows for rate heterogeneity along any branches of the tree. RelTime computes branch-specific relative rates from the tree by averaging branch lengths for each pair of descendants at each node. Check out the paper if you want to dig into the math. The result is a tree with relative divergence times, which then can be converted to absolute divergence times using only a few fossil calibration points in a post hoc application. I assume geographic calibrations such as island age could just as easily be used to calibrate the tree.
The biggest advantage of this method is that it is very fast – the authors claim it is 1000 times faster than MCMCTree, which in turn is 1000 times faster than BEAST on their simulated dataset of 446 taxa – yet it performs as well as or better than popular Bayesian methods. It also outperforms Bayesian methods when evolutionary rates vary drastically across the tree.
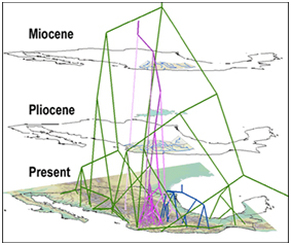
One exciting aspect of the method is that, according to the authors, “the branch (relative) rates produced by RelTime directly reveal the statistical properties of the distribution of evolutionary rates in a phylogeny, which exposes clades and lineages with significantly slower or faster evolutionary rates.” For a lab studying the radiation of the Hawaiian Drosophila, this is an important application. There are multiple examples in the clade where evolutionary rates probably exploded when a lineage colonized a new island or niche. RelTime looks like it is worth trying as a way to rapidly assess this phenomenon.
Brian
In phylogenetics we try to determine two things, the relationships between taxa and the timing of their divergence, either in relative or absolute time. The most common way to date divergence times is to calibrate a molecular phylogeny using the fossil record. Some form of a molecular clock is then assumed to extrapolate rates of evolution and divergence times to uncalibrated parts of the tree. This extrapolation requires assumptions about if and how rates of sequence evolution vary along different branches of the tree. Phylogenetics programs like BEAST require the user to specify, a priori, a statistical distribution from which to model evolutionary rate heterogeneity among tree branches. This method has been largely successful, but is limited computationally because the complexity increases exponentially as the number of taxa in the tree increases. Thus, the challenge with large datasets is that it can take weeks for even powerful computers to complete each step of the analysis.
RelTime attempts to circumvent this computational limitation by calculating relative divergence times rather than placing them in the context of absolute time. To me, it looks similar to Neighbor Joining methods used for creating tree topology, except that the method assumes a bifurcating topology with branch lengths, then uses distance calculations as it allows for rate heterogeneity along any branches of the tree. RelTime computes branch-specific relative rates from the tree by averaging branch lengths for each pair of descendants at each node. Check out the paper if you want to dig into the math. The result is a tree with relative divergence times, which then can be converted to absolute divergence times using only a few fossil calibration points in a post hoc application. I assume geographic calibrations such as island age could just as easily be used to calibrate the tree.
The biggest advantage of this method is that it is very fast – the authors claim it is 1000 times faster than MCMCTree, which in turn is 1000 times faster than BEAST on their simulated dataset of 446 taxa – yet it performs as well as or better than popular Bayesian methods. It also outperforms Bayesian methods when evolutionary rates vary drastically across the tree.
One exciting aspect of the method is that, according to the authors, “the branch (relative) rates produced by RelTime directly reveal the statistical properties of the distribution of evolutionary rates in a phylogeny, which exposes clades and lineages with significantly slower or faster evolutionary rates.” For a lab studying the radiation of the Hawaiian Drosophila, this is an important application. There are multiple examples in the clade where evolutionary rates probably exploded when a lineage colonized a new island or niche. RelTime looks like it is worth trying as a way to rapidly assess this phenomenon.
Brian
 RSS Feed
